Hi! Welcome to my website!
Hi there! My name is Sienna White and I am a Ph.D. student at UC Berkeley (2021 - 2026, hopefully!), working with Professor Mark Stacey. I’ve written up some of my research experience below. For a more formal CV, see here. I’m grateful to be funded by the Computational Science Graduate Fellowship through DOE. Please feel free to reach out to me at any time (thoughts on research! potential collaboration! application review for the CSGF! egregious typos on this site!) at sienna w at berkeley dot edu .
RESEARCH EXPERIENCES:
Predicting harmful algal blooms in the Sacramento-San Joaquin Delta (Dissertation Research)
Water quality in the San Francisco Bay Delta affects regional water resources, ecosystem health, and quality of life for any of the two million people who interact with the Delta or call its shores home. However, water management in the Delta has become a heavily politicized issue, as large-scale water withdrawal for agriculture and state water projects often comes at the cost of ecosystem protection measures.
The Delta receives large inputs of anthropogenic nutrients from wastewater treatment plants which result in elevated dissolved inorganic nitrogen levels (Novick et al., 2015). This nutrient-enriched status places the Delta at high risk for algal blooms (Paerl, 2009; Dahm et al., 2016), including risk for bloom events with toxic, or harmful algal species (commonly referred to as harmful algal blooms, or HAB events). These harmful algal blooms threaten public health and endanger the potability of the water supply. Furthermore, climate change, reduced sediment load, and increased nutrient delivery have accelerated algal bloom activity, resulting in increased harmful algal bloom events (Lehman et al., 2017).
My PhD research will focus on using numerical models to investigate the specific mechanisms that precipitate harmful algal blooms, which likely involves a “goldilocks zone” of wind-driven mixing, tidal forcing, river outflow, nutrient supply, and temperature. Better understanding what conditions allow Microcystis (a harmful algal species) to dominate over “beneficial algal species” (diatoms) will then be used to inform a prediction framework, providing water managers with much-needed visibility of where (and when) harmful algal blooms are likely to occur.
Data assimilation for wildfire smoke models
During my first year at UC Berkeley (2021-2022), I decided to try my hand at atmospheric modeling and was lucky enough to do so under the mentorship of Prof. Tina Chow and Dr. Rebecca Segrue. I worked on “Partnering for Resilient Opportunities To Eliminate Cumulative Toxic (PROTECT) Health Effects from Wildfire PM2.5 in Environmental Justice Communities,” an EPA Region 9 grant involving a consortium of scientists from Berkeley, LBNL, and UCSF. The overreaching goal of this grant was to explore how long-term exposure to wildfire smoke has impacted public health in environmental justice communitiies. In order to do so, our team focused on assimilating observational data into modeled wildfire smoke fields to generate an hourly “best guess” of smoke concentrations across California from 2016-2020. These results were then passed off to public health researchers for exposure analysis. You can learn more about the overall grant here. For me, it was a great opportunity work directly with researchers in the public health/medical space and gain a broader persepctive on the utility (and lack thereof) of numerical modeling for providing input data to other disciplines.
Background on data assimilation
Data assimilation is a statistical exercise that attempts to address the very useful question of “how can we combine observational data with model results when we know there are errors in both methods?” (If it’s useful to anyone, I might come back later and add a better explanation here – please reach out!). It’s commonly employed in weather forecasting, as weather forecasts have extraordinary sensitivity to their initial condition – so everytime you restart a weather model, it makes sense to check what your model is saying and what measurements-on-the-ground report. I found this paper by Ahmed et al. (2020) to be a very accessible, well-explained walkthrough on what this looks like mathematically.
As it turns out, unbeknownest to me, meteorologists have mastered data assimilation for both static fields (e.g., generating intial conditions) with all sorts of data, including satellite irradiance and weather balloon data with a host of methodologies (3-D Var, Ensemble Kalman Filter, etc) Beyond looking at a snapshot in time, there’s also a data assimilation practice known as “4D-Var” which incorporates observational data into a model as it’s running. For this exercise, I stuck to the simplest possible implementation of data assimilation, and with the very patient guidance of our collaborators at NOAA was able to deploy the Gridpoint Statistical Interpolation tool (GSI) for 3D-Var assimilation.
.png)
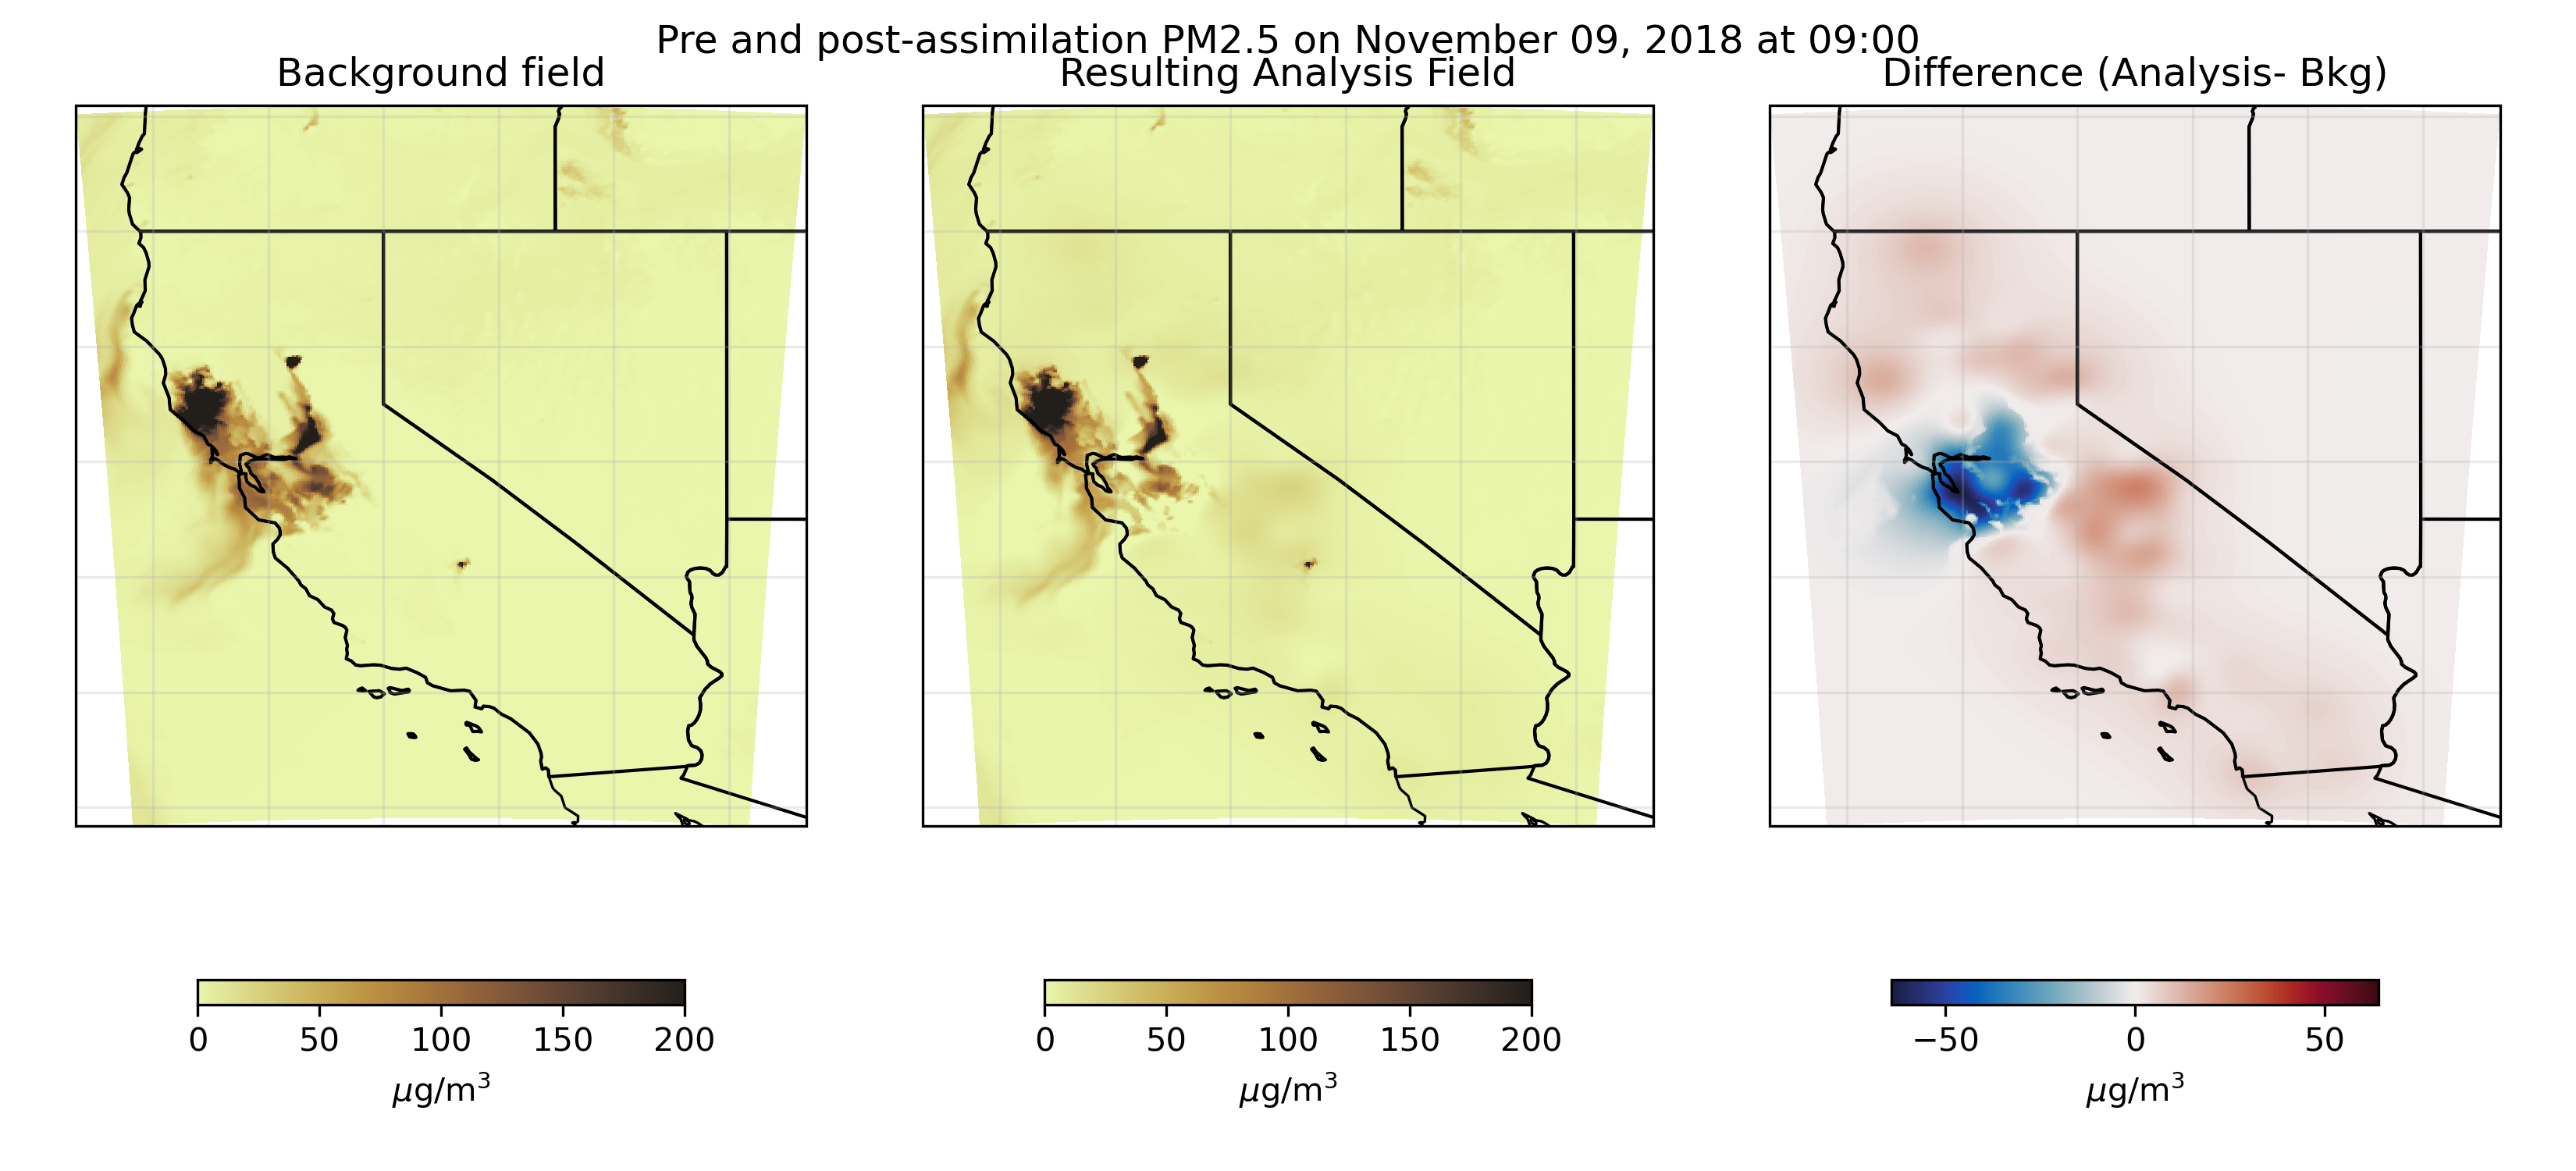
Our methodology
For our “background field” (e.g, initial model result) we used simulations from HRRR-Smoke, an implementation of the high-resolution rapid refresh model that includes smoke as a tracer. We started with raw GRIB2 model output and used WPS/WRF utilites to prepare an input file for GSI. Most of this work involved developing efficient pipelines for processing enormous quantities of data. We then assimilated observational data from EPA AirNow sensors as well as Purple Air. (One ongoing question of this research involves how best to quantify the observational error in Purple Air sensors when assimilation these data into the modeled smoke field.) You can see an example of this assimilated smoke field here.
If this dataset is interesting to you, or if you’d like me to share the python repositories I developed to perform and automate this process, please reach out.
Biogeochemical + hydrodynamic modeling with the San Francisco Estuary Institute
Before starting grad school at Berkeley, I worked for two years at the San Francisco Estuary Institute on the Clean Water program under Dr. David Senn. Our team used computational models to study nutrient cycling and primary productivity in the Bay Area. We maintained two DFlow-FM hydrodynamic models of San Francisco Bay (one focused on resolving the Sacramento-San Joaquin Delta) coupled to an offline biogeochemical module (Delft Water Quality, also known as DELWAQ). My work focused mainly on calibrating and validating our model(s) for a range of water years, as well as post-processing model results to communicate with stakeholders.
Our work is publicly available here and here, but it’s ocassinally hard to find, so please reach out if you have any questions or want to learn more – our work is open source and I’m happy to talk about San Francisco Bay dynamics truly anytime !
River morphology @ TU Delft
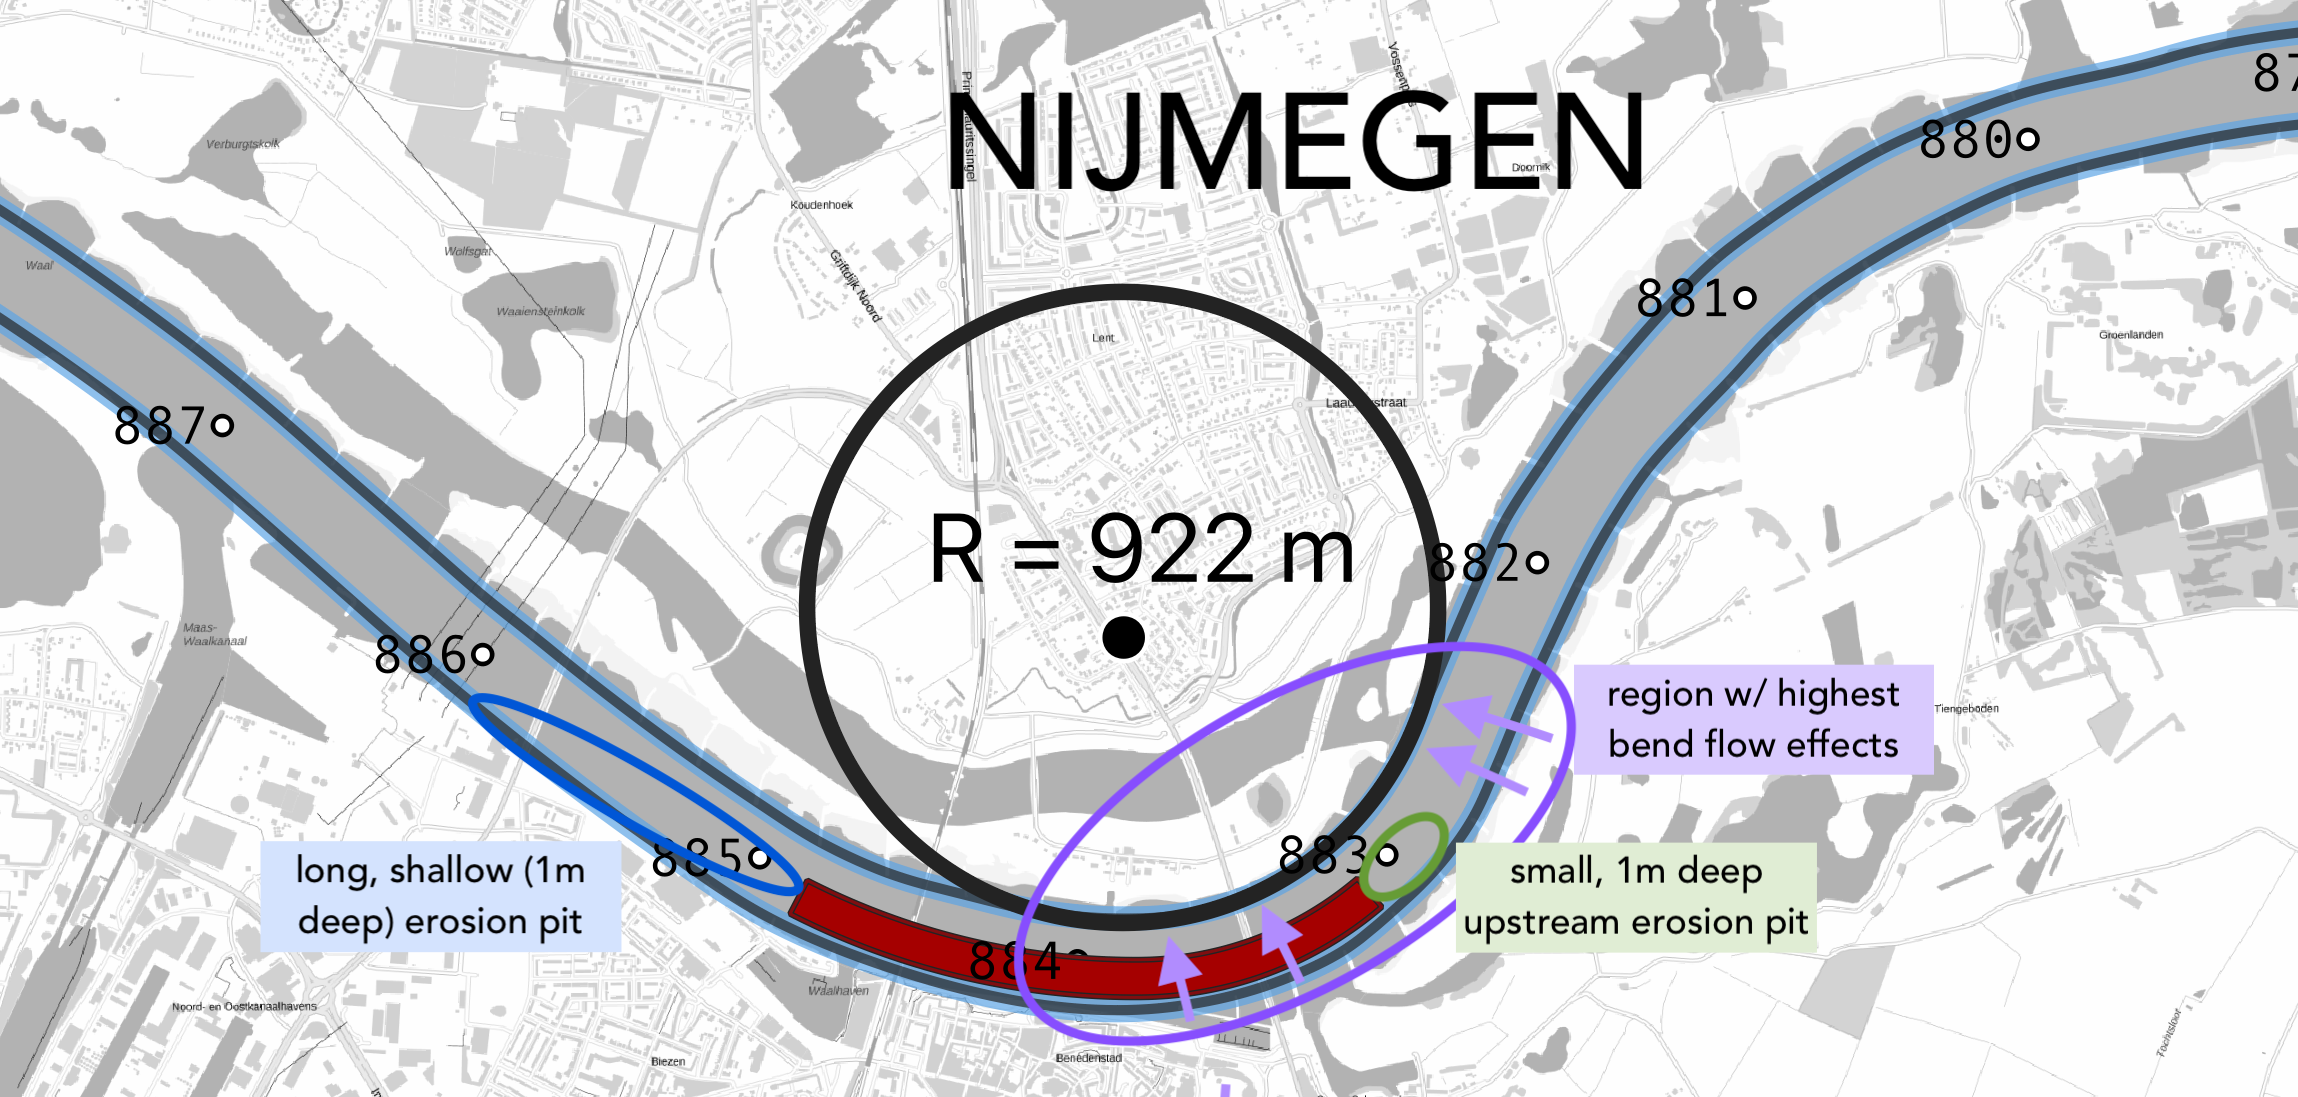
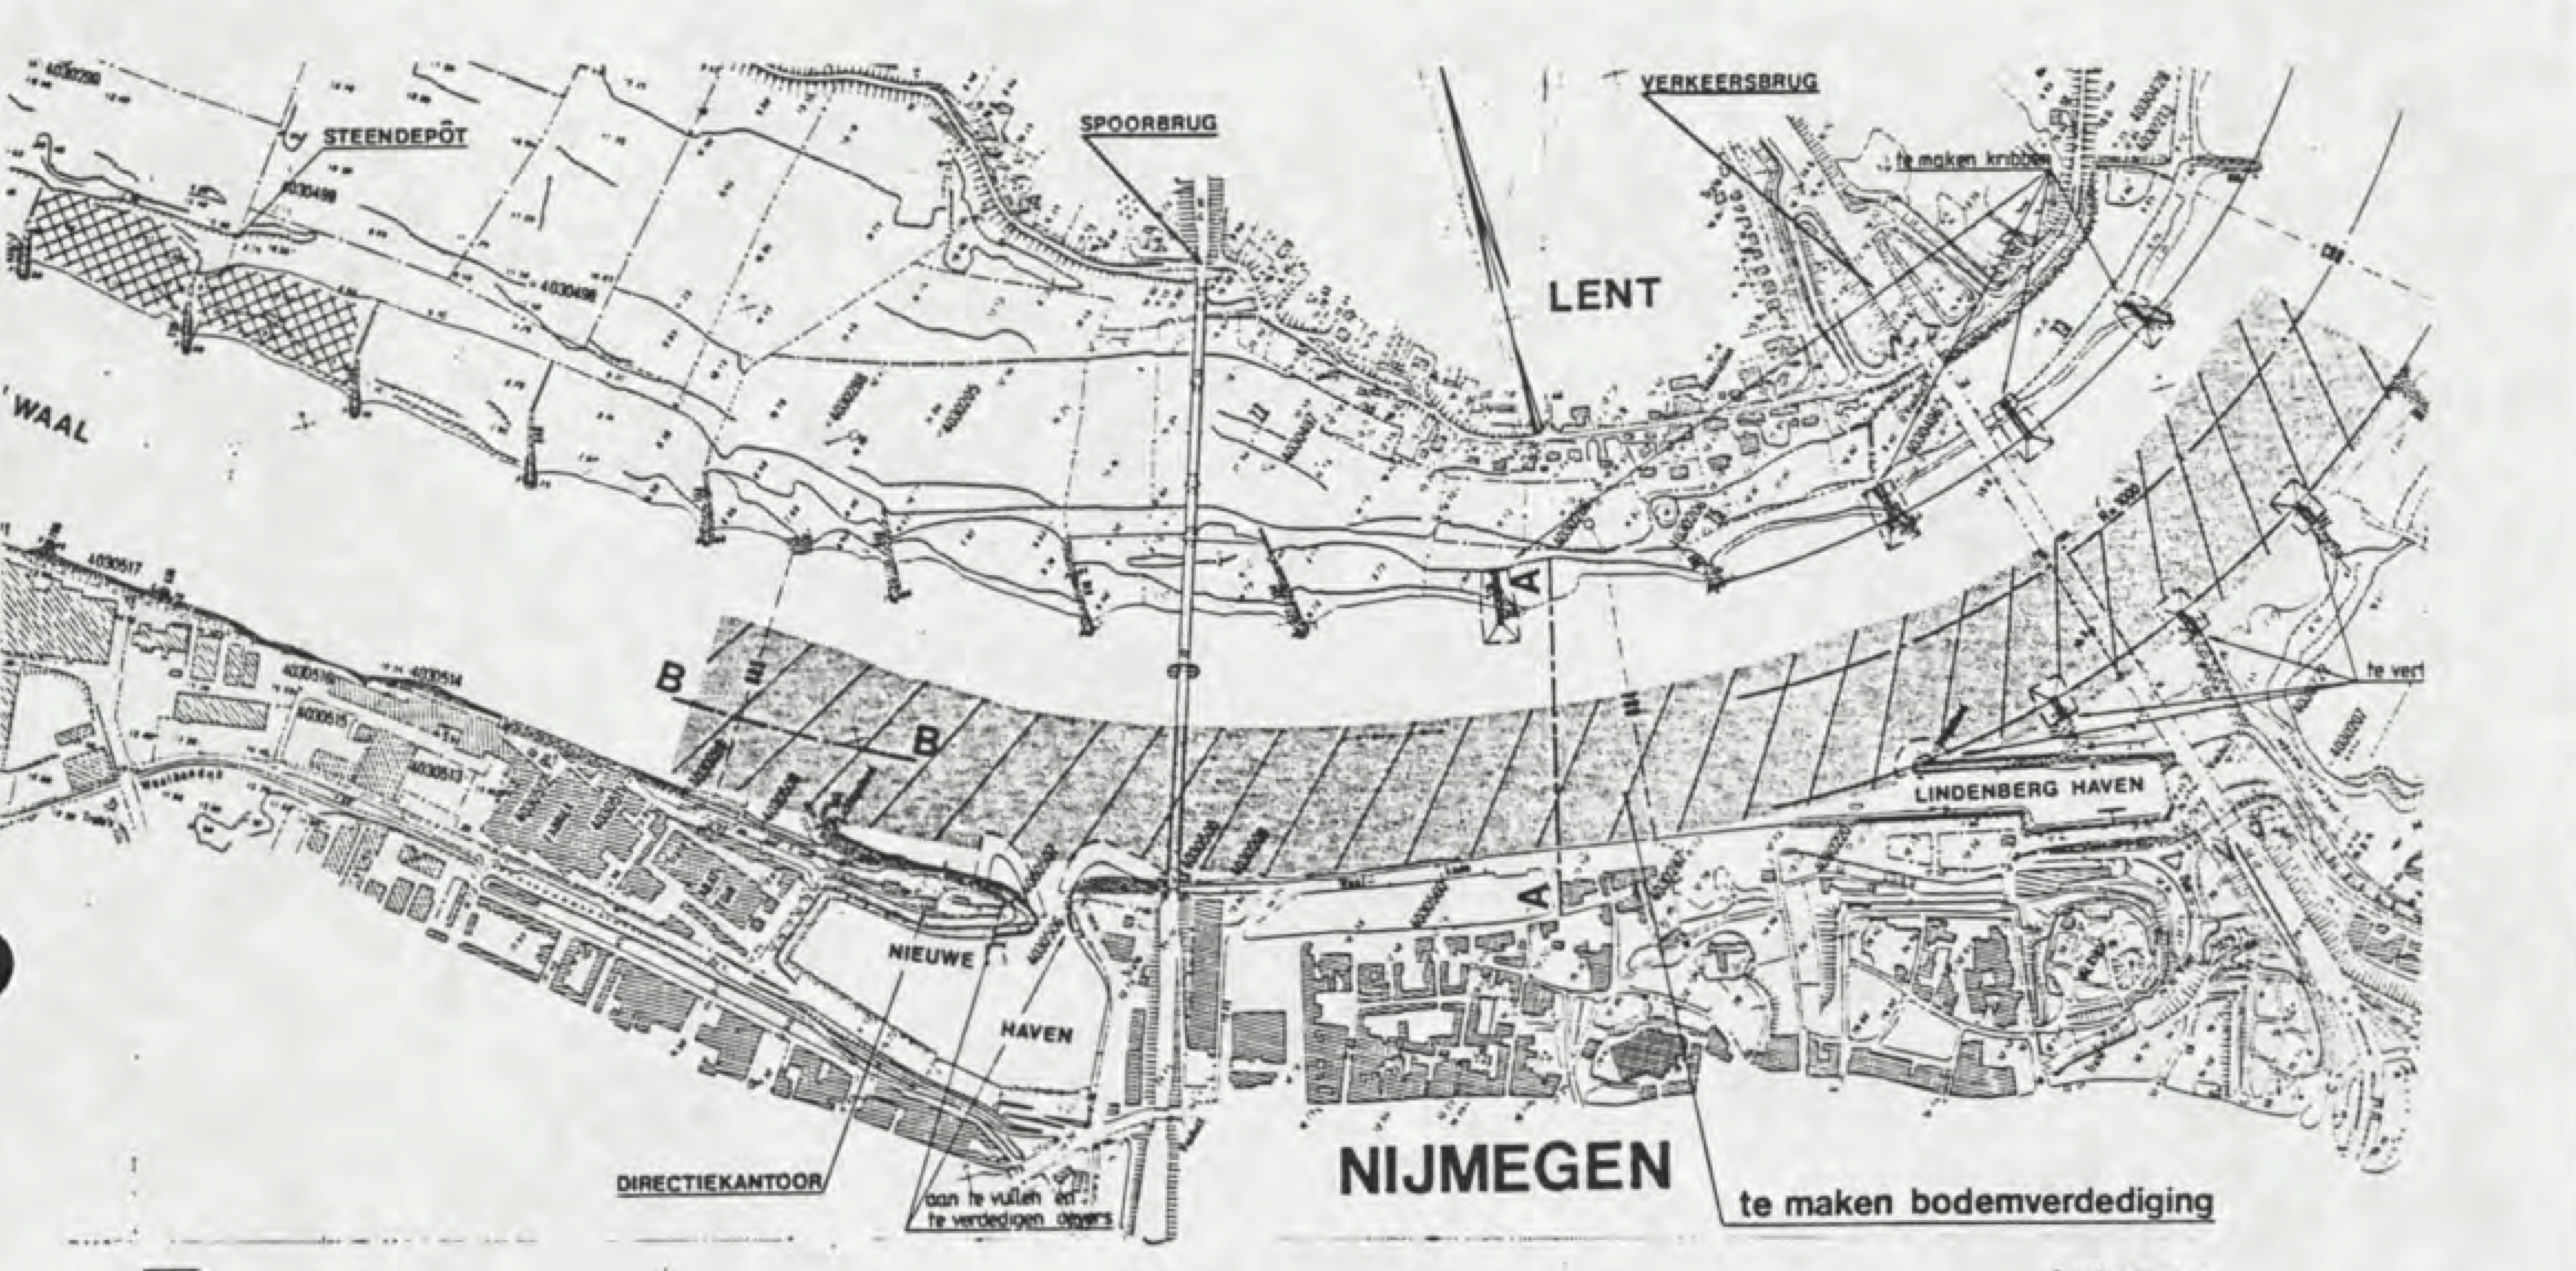
From 2019-2020 I was awarded a Fulbright to perform river morphology research at the Technische Universiteit Delft with Prof. Astrid Blom. I worked on a project examining the effect of fixed beds (an engineering river intervention) on wide-scale morphodynamics on the Waal River using computational geospatial analysis in Python, QGIS, and MATLAB. This project involved close collaboration with Rijkswaterstaat, the Dutch water ministry. You can read my final report here
Sediment transport in San Francisco Bay
- link honors thesis
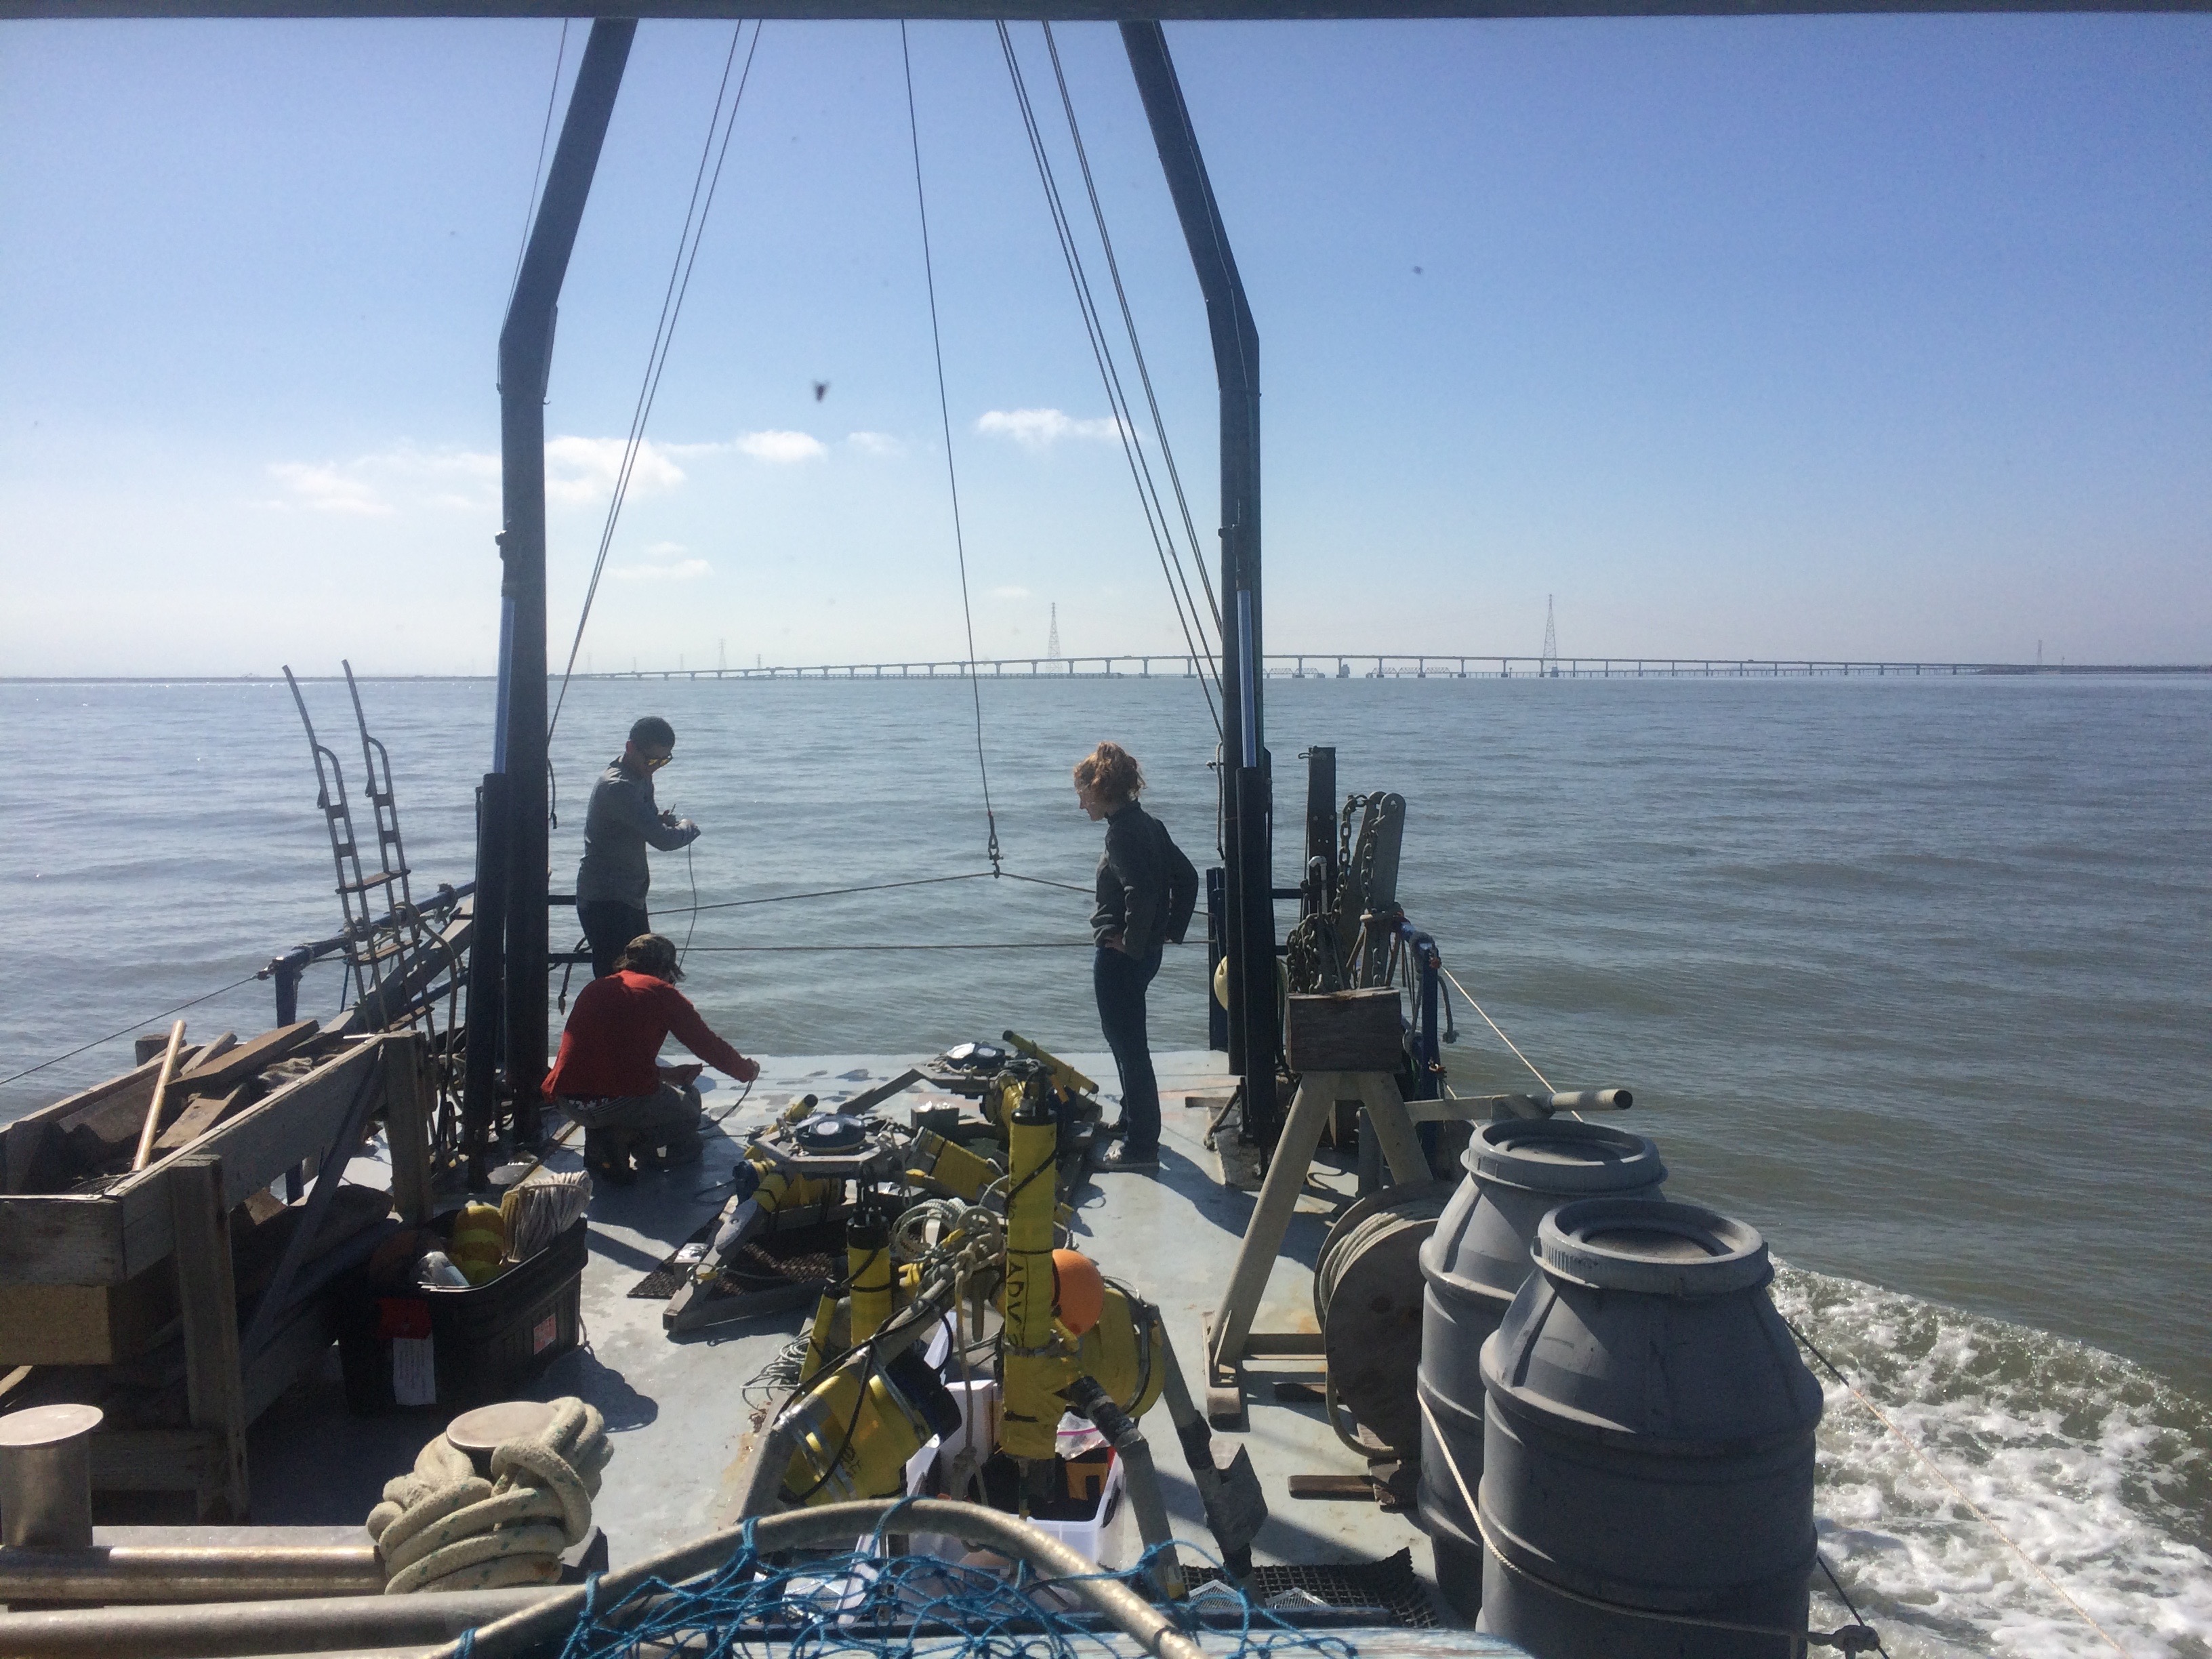 {width=800px}
I’m interested in environmental fluid mechanics, computational fluid modeling, estuarine physics, sediment dynamics …. benthic grazers … etc. I finally got around to making a website, so if you found your way here, either on purpose or accident, I’m glad you made it! Feel free to reach out.
Hi there! My name is Sienna White and I am a Ph.D. student at UC Berkeley, working with Professor Tina Chow on data assimilation for smoke modeling. I’m interested in environmental fluid mechanics, computational fluid modeling, estuarine physics, sediment dynamics …. benthic grazers … etc.
Before I started my PhD at Berkeley, I worked for two years at the San Francisco Estuary Institute on the Clean Water team under Dr. David Senn. At SFEI, I used computational models to study nutrient cycling and primary productivity in the Bay Area. We ran our hydrodynamic model using DFlow-FM and our biogeochemical module was coupled offline using Delft Water Quality (DELWAQ). Our work is publicly available here and here, but it’s ocassinally hard to find, so please reach out if you have any questions or want to learn more – our work is open source and I’m happy to talk about San Francisco Bay dynamics truly anytime !
A data-driven personal website
Like many other Jekyll-based GitHub Pages templates, academicpages makes you separate the website’s content from its form. The content & metadata of your website are in structured markdown files, while various other files constitute the theme, specifying how to transform that content & metadata into HTML pages. You keep these various markdown (.md), YAML (.yml), HTML, and CSS files in a public GitHub repository. Each time you commit and push an update to the repository, the GitHub pages service creates static HTML pages based on these files, which are hosted on GitHub’s servers free of charge.
Many of the features of dynamic content management systems (like Wordpress) can be achieved in this fashion, using a fraction of the computational resources and with far less vulnerability to hacking and DDoSing. You can also modify the theme to your heart’s content without touching the content of your site. If you get to a point where you’ve broken something in Jekyll/HTML/CSS beyond repair, your markdown files describing your talks, publications, etc. are safe. You can rollback the changes or even delete the repository and start over – just be sure to save the markdown files! Finally, you can also write scripts that process the structured data on the site, such as this one that analyzes metadata in pages about talks to display a map of every location you’ve given a talk.
Getting started
- Register a GitHub account if you don’t have one and confirm your e-mail (required!)
- Fork this repository by clicking the “fork” button in the top right.
- Go to the repository’s settings (rightmost item in the tabs that start with “Code”, should be below “Unwatch”). Rename the repository “[your GitHub username].github.io”, which will also be your website’s URL.
- Set site-wide configuration and create content & metadata (see below – also see this set of diffs showing what files were changed to set up an example site for a user with the username “getorg-testacct”)
- Upload any files (like PDFs, .zip files, etc.) to the files/ directory. They will appear at https://[your GitHub username].github.io/files/example.pdf.
- Check status by going to the repository settings, in the “GitHub pages” section
Site-wide configuration
The main configuration file for the site is in the base directory in _config.yml, which defines the content in the sidebars and other site-wide features. You will need to replace the default variables with ones about yourself and your site’s github repository. The configuration file for the top menu is in _data/navigation.yml. For example, if you don’t have a portfolio or blog posts, you can remove those items from that navigation.yml file to remove them from the header.
Create content & metadata
For site content, there is one markdown file for each type of content, which are stored in directories like _publications, _talks, _posts, _teaching, or _pages. For example, each talk is a markdown file in the _talks directory. At the top of each markdown file is structured data in YAML about the talk, which the theme will parse to do lots of cool stuff. The same structured data about a talk is used to generate the list of talks on the Talks page, each individual page for specific talks, the talks section for the CV page, and the map of places you’ve given a talk (if you run this python file or Jupyter notebook, which creates the HTML for the map based on the contents of the _talks directory).
Markdown generator
I have also created a set of Jupyter notebooks that converts a CSV containing structured data about talks or presentations into individual markdown files that will be properly formatted for the academicpages template. The sample CSVs in that directory are the ones I used to create my own personal website at stuartgeiger.com. My usual workflow is that I keep a spreadsheet of my publications and talks, then run the code in these notebooks to generate the markdown files, then commit and push them to the GitHub repository.
How to edit your site’s GitHub repository
Many people use a git client to create files on their local computer and then push them to GitHub’s servers. If you are not familiar with git, you can directly edit these configuration and markdown files directly in the github.com interface. Navigate to a file (like this one and click the pencil icon in the top right of the content preview (to the right of the “Raw | Blame | History” buttons). You can delete a file by clicking the trashcan icon to the right of the pencil icon. You can also create new files or upload files by navigating to a directory and clicking the “Create new file” or “Upload files” buttons.
Example: editing a markdown file for a talk 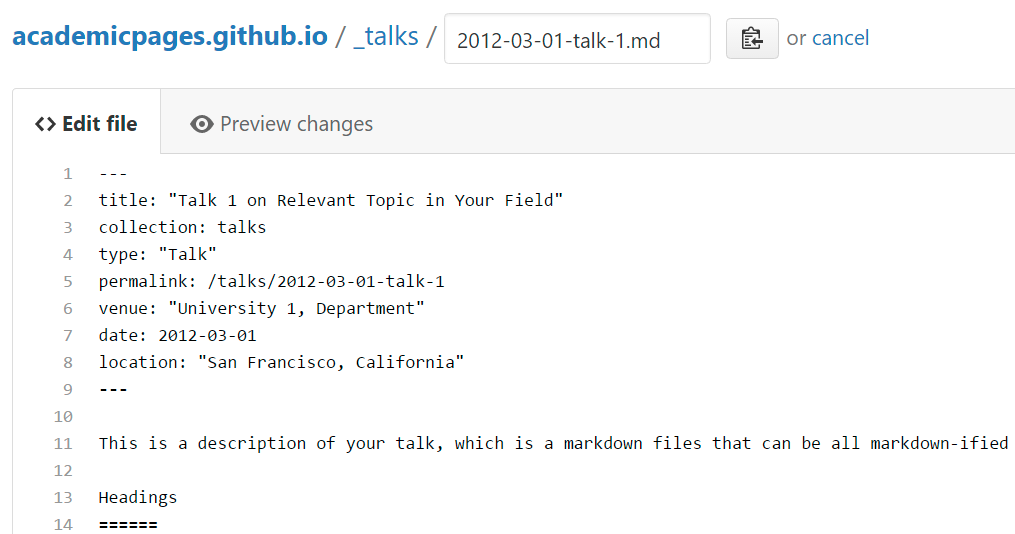
For more info
More info about configuring academicpages can be found in the guide. The guides for the Minimal Mistakes theme (which this theme was forked from) might also be helpful.